Figure 8.
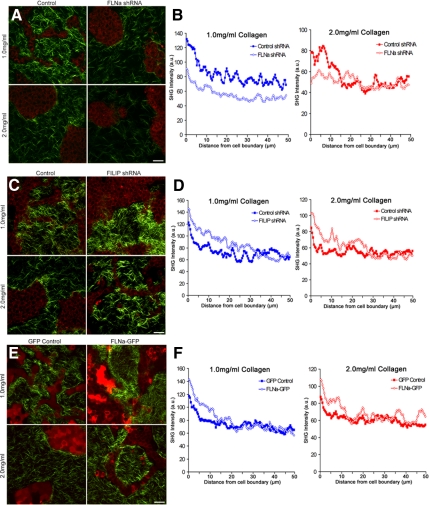
FLNa levels regulate collagen matrix remodeling. (A) FLNa shRNA reduces collagen fibril condensation and matrix reorganization. Collagen (green) and cell autofluorescence (red) were imaged using SHG and MPLSM, respectively. Bar, 50 μm. (B) Line scan of SHG images represented in A to quantify the fluorescence intensity taken from the edge of the cell–ECM boundary (0 μm) into the collagen matrix of low- and high-density floating gels. Data are averaged from a minimum of six images, three measurements per image. At 5 μm, statistical difference p < 0.01 (1.0 control vs. 1.0 FLNa shRNA), p < 0.05 (2.0 control vs. 2.0 FLNa shRNA)(two-sample t test) and p < 0.0001 by regression analysis. (C) FILIP shRNA enhances collagen fibril condensation. Cell autofluorescence (red) and collagen (green) were imaged using MPLSM and SHG imaging, respectively. Bar, 50 μm. (D) Average fluorescence intensity of collagen fibrils in low- and high-density floating gels. Line scans were taken from the edge of the cell–ECM boundary (0 μm) into the collagen matrix. Data are averaged from a minimum of six images, three measurements per image. p < 0.05 statistical difference at 5 μm (1.0 control vs. 1.0 FILIP shRNA; 2.0 control vs. 2.0 FILIP shRNA) (two-sample t test), and p < 0.0001 by regression analysis. (E) FLNa-GFP enhances collagen fibril condensation near cell structures. GFP-labeled cells (pseudocolored red) and collagen (green) were imaged using MPLSM and SHG imaging, respectively. Bar, 50 μm. (F) Fluorescence intensity measurements were taken from the edge of the cell–ECM boundary (0 μm) into the collagen matrix of low and high-density floating gels. Data are averaged from a minimum of eight images, three measurements per image. At 5 μm, statistical difference p < 0.05 (1.0 GFP control vs. 1.0 FLNa-GFP; 2.0 GFP control vs. 2.0 FLNa-GFP) (two-sample t test), and p < 0.0001 by regression analysis.

