Figure 3.
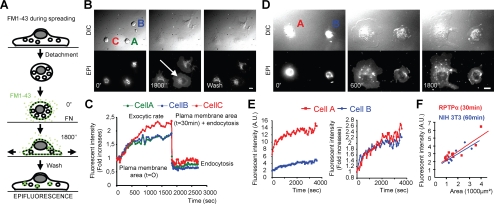
PM area increase is due to the balance between exocytosis and endocytosis. (A) Schematic representation of the FM1-43 during spreading protocol (see Materials and Methods). (B) RPTPα cells using the FM1-43 during spreading protocol. Arrow, perinuclear region brightening showing endocytosis. Bar, 10 μm. (C). FM1-43 fluorescence intensity (-fold increases, compared with the initial FM1-43 fluorescence intensity at t = 0″) of each cells plotted as a function of time. (D) Same as B, but without wash and for cells presenting a significant difference in size. (E) FM1-43 fluorescence intensity and fluorescence intensity -fold increases plotted as a function of time for each cell presented in D. (F) Substrate contact area plotted in function of the initial PM area (represented by the FM1-43 fluorescence intensity at t = 0″) after 30 min of spreading for RPTPα cells (red dots and red fitting line; n = 10) and 60 min of spreading for NIH-3T3 cells (blue dots and blue fitting line; n = 10).

