Figure 4.
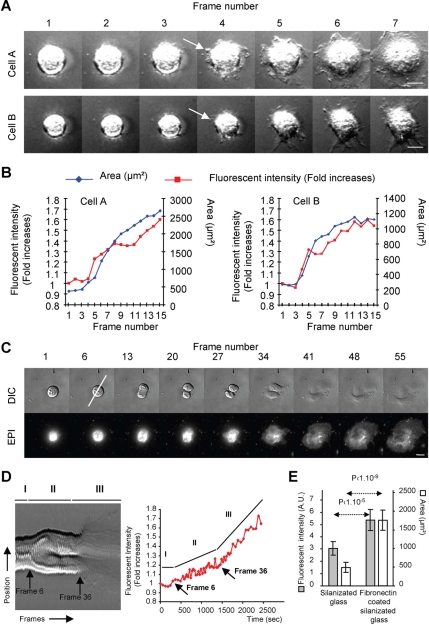
Membrane exocytosis is induced by spreading. (A) Consecutive seven DIC frames acquired at 120-s intervals presented sequentially for two NIH-3T3 cells (Supplemental Figure 2 and Supplemental Video 3). The arrows point to the first expansions presented by the cells. Bar, 10 μm. (B) FM1-43 fluorescence intensity (-fold increase) and substrate contact area of the two cells plotted as a function of frame number. (C) Images of RPTPα cell analyzed with the FM1-43 during spreading protocol during mitosis and postmitotic spreading. Bar, 10 μm. (D) Left, kemograph analysis of the line depicted in C. Different stages of cell division can be identified: before anaphase (I), anaphase to cytokinesis (II), and postmitotic spreading (III). Right, FM1-43 fluorescence intensity -fold increases plotted as a function of time. The three cell division stages correspond to three exocytosis rates: no exocytosis (I), moderate exocytosis (II), and rapid exocytosis (III). (E) NIH-3T3 cells analyzed using the FM1-43 during spreading protocol, after 60 min of spreading from uncoated or fibronectin-coated regions of the same coverslip. Averages of FM1-43 fluorescence intensity and area per cell are presented. Errors bars, SD. n = 50 cells from a typical experiment.

