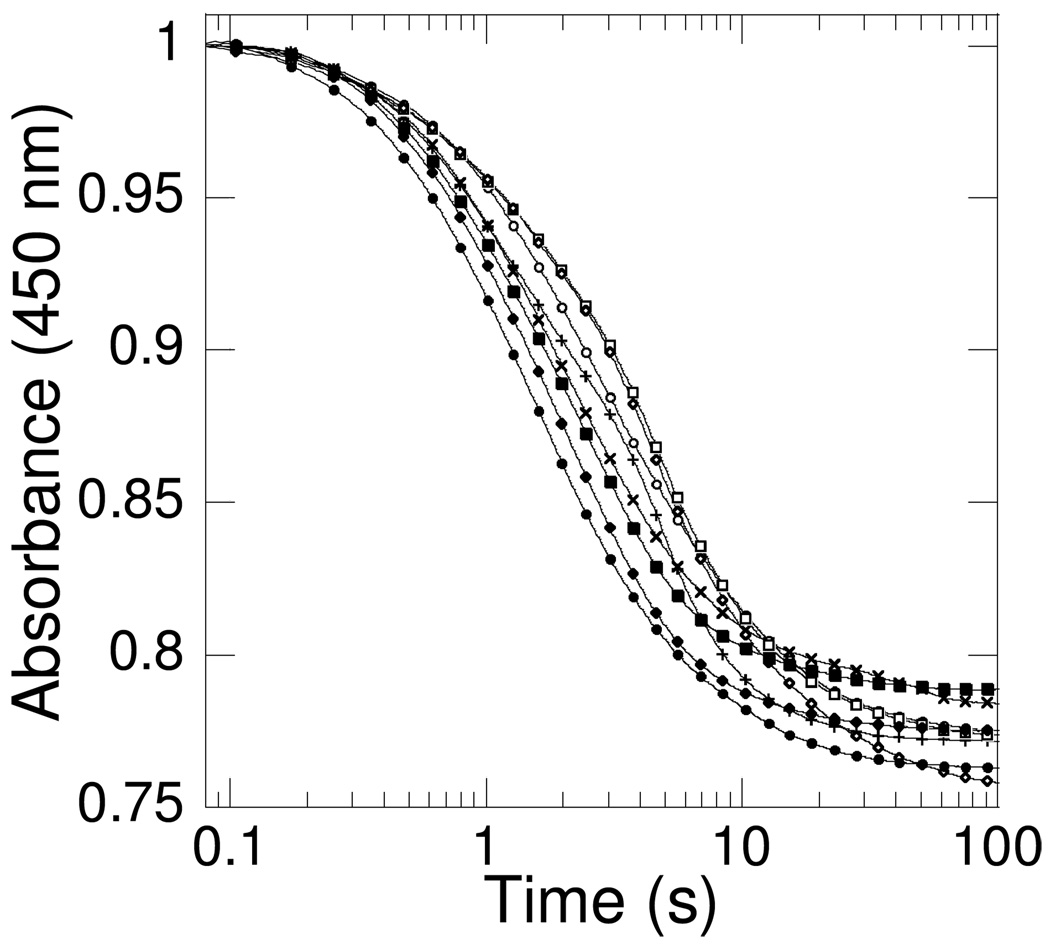
Figure 2.
Reductive half-reaction kinetics of PvdA. Absorbance-versus-time traces under different mixing conditions. Eight different mixing conditions were tested in oxygen-free 100 mM potassium phosphate pH 8.0 buffer containing PvdA (290 µM) at 22 °C. The coenzyme and cosubstrate concentrations were: FAD (60 µM) and NADPH (360 µM) in the same buffer and the spectra were recorded using a stopped-flow spectrometer equipped with a photomultiplier tube. Ornithine (10 mM) was included in some of the reaction mixtures. The curves were fit to a double exponential equation presumably for FAD reduction and NADP+ release (KaleidaGraph 4). E v FN (●) where E = enzyme, F = FAD, N = NADPH, and v = versus (mixed with), kobs = 0.63 and 0.11 s−1; ES v FN (♦) where S = ornithine, kobs = 0.50 and 0.08 s−1; E v FNS (■), kobs = 0.47 and 0.07s−1; EN v FS (+), kobs = 0.55 and 0.21 s−1; EN v F (×), kobs = 0.45 and 0.04 s−1; EF v N (○), kobs = 0.39 and 0.08 s−1; EF v NS (□), kobs = 0.33 and 0.11 s−1; EFS v N (◇), kobs = 0.24 and 0.04 s−1. The data points for each mixture were measured in duplicate and averaged. Every 20th data point is displayed for each fit curve.

