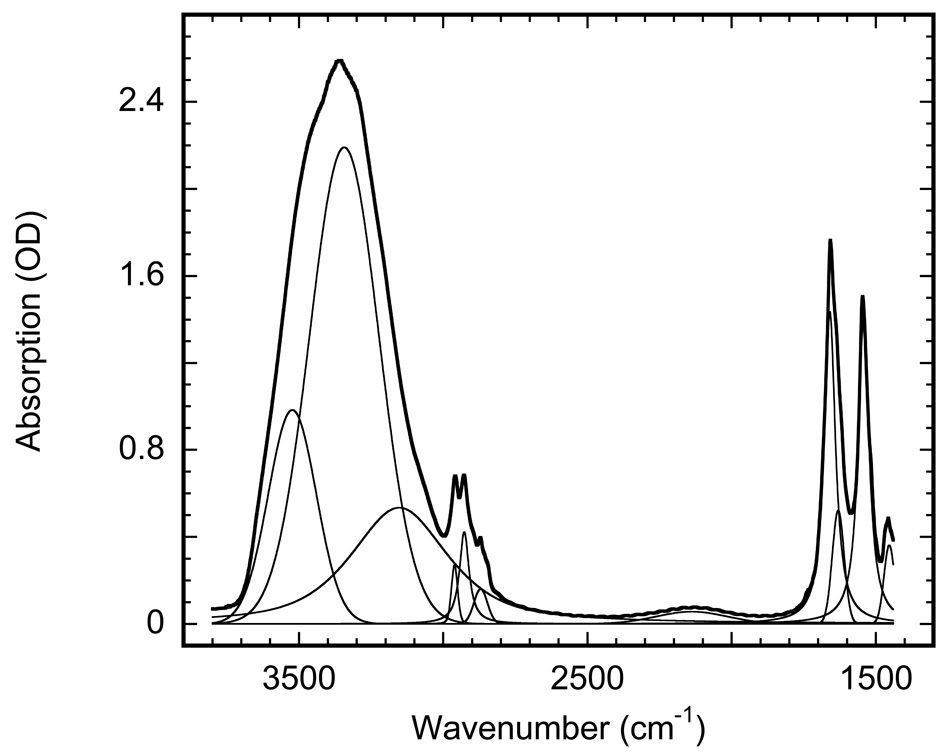
Figure 1.
Absorption spectrum of a purple membrane film (wild-type bacteriorhodopsin) at pH 6.9 deposited on an IR window from 1 mM HEPES solution. The bold line is the measured spectrum, the thin lines are the result of fitting (r−1≥0.999) with weighted sum of Gaussian and Lorentzian bands, which contain12 peaks: (i) five for water at 3523, 3340, 3137, 2131, 1628 cm−1;, (ii) four for methyl and methylene bands of lipids at 2961, 2927, 2871 and 2846 cm−1; and (iii) three for amide bands of the retinal at 1658, 1543 and 1453 cm−1. The band at 2846 cm−1 is barely seen in the figure, since its amplitude is ~1/5 of that of the already small neighboring band at 2871 cm−1.

