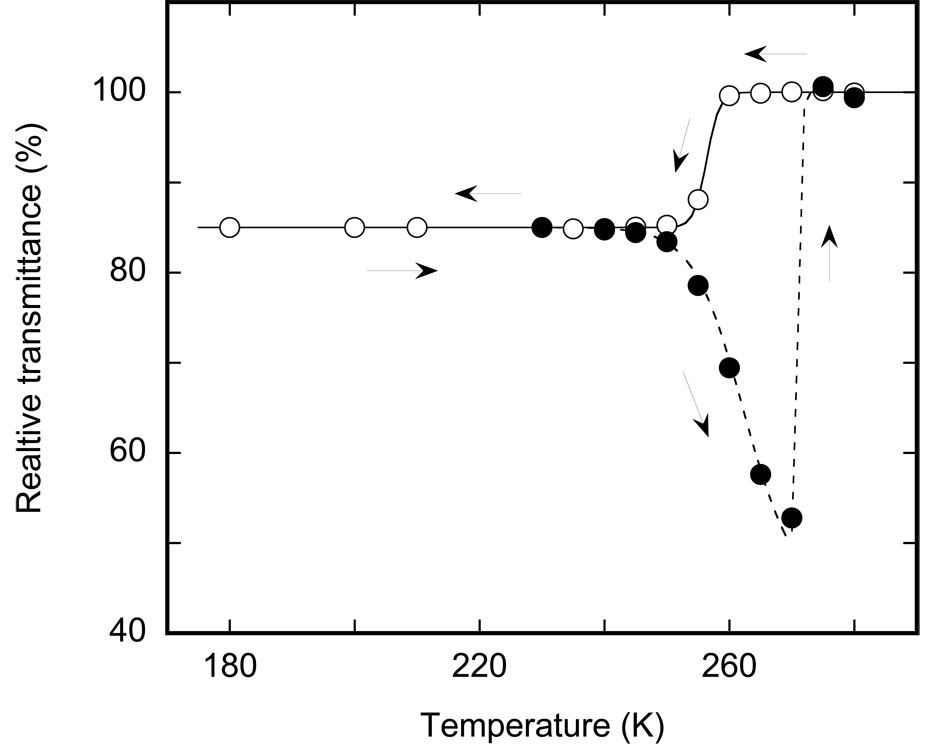
Figure 2.
Temperature dependence of the overall IR transmittance, measured as the raw amplitude of the signal from the IR detector prior to Fourier transformation. The solid line and open circles depict the cooling branch from 280 to 180 K; the broken line and filled circles illustrate the heating of the sample after the previous cooling to 180 K (see arrows). Cooling and heating between 180 and 240 K do not noticeably affect the overall transmittance despite a change in the absorption below 220 K (see Figure 3).

