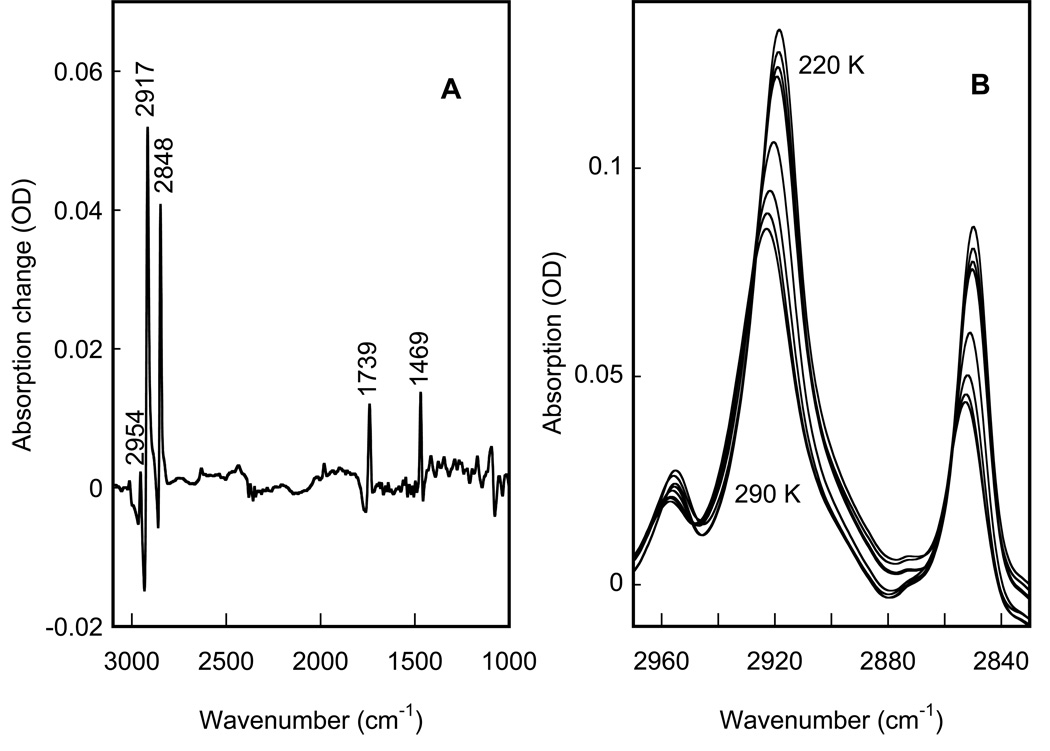
Figure 5.
IR spectral changes in the main phase transition in a hydrated phosphatidylcholine film, shown to define the changes during a phase transition in lipids. A: difference spectrum between 290 and 220 K. B: corresponding absorption spectra in the methyl and methylene stretch region, with the IR bands that increase in amplitude as the temperature is decreased from 290 K in 10 K steps, and down-shift in frequency.

