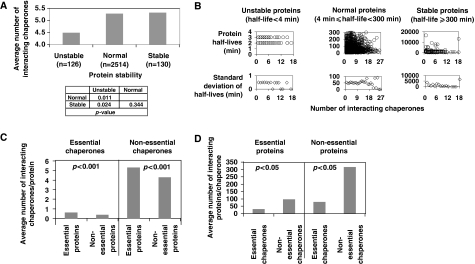
Figure 2.
Characterization of chaperone interactors. (A) The average number of chaperones interacting with proteins of different half-lives. (B) Top panels show a plot of protein half-lives versus the number of interacting chaperones for the ‘unstable', ‘stable', and ‘normal' groups of proteins. Lower panels show the s.d. of protein half-lives versus the number of interacting chaperones. (C) A comparison of the average number of interacting chaperones per protein on the basis of essentiality. (D) A comparison of the average number of interacting proteins per chaperone on the basis of essentiality. In (A, C, D) statistical significance is on the basis of the Mann–Whitney test.

