Figure 3.
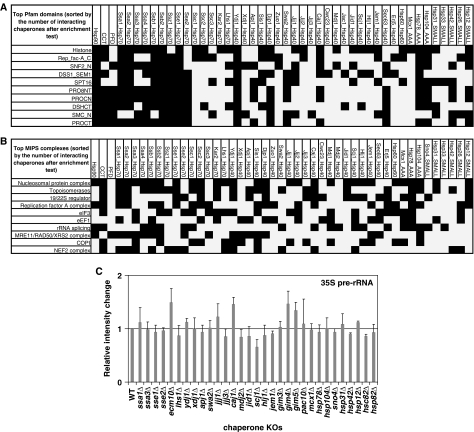
Interaction of chaperones with Pfam domains and protein complexes. (A) The top ten Pfam domains enriched in chaperone interactors. (B) The top ten MIPS complexes enriched in chaperone interaction. In (A) and (B), a hypergeometric distribution was assumed to assess enrichment (refer to Materials and Methods). (C) Results of the northern blot analyses for 35S pre-rRNA from 31 different chaperone knockout strains grown at 30°C in YPD media for 3 days. Data shown are averages of three repeats. Bands were normalized to the band corresponding to U2 RNA and then divided by the corresponding value for the wildtype (Zhao et al, 2008).

