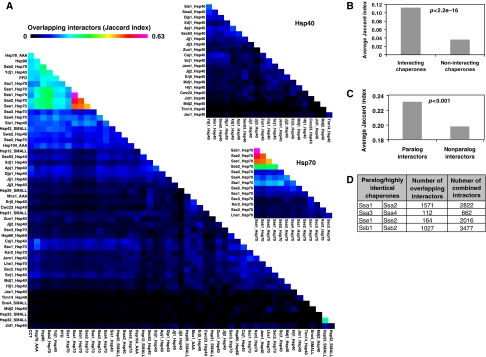
Figure 5.
Interactor overlap among chaperones. (A) A heat map highlighting the overlap of non-chaperone interactors among the 50 chaperones/chaperone complexes using the Jaccard indices. (B) Comparison of the number of interacting chaperones versus non-interacting chaperones on the basis of the Jaccard index derived from several non-chaperone interactors. (C) The relationship between paralog and non-paralog interactors on the basis of chaperone overlap. (D) Shown are the numbers of interactor overlap between paralog/highly identical chaperones. The identities between chaperones in each pair are as follows: Ssa1–Ssa2 98.2%, Ssa3–Ssa4 86.9%, Sse1–Sse2 77.2%, and Ssb1–Ssb2 99.4%. In (B and C) statistical significance is on the basis of the Mann–Whitney test.

