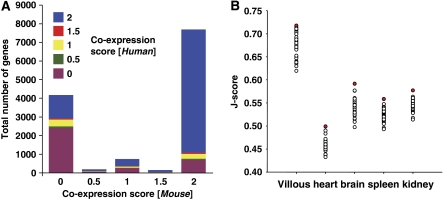
Figure 1.
Correlation of microarray expression in human and mouse. (A) A stacked bar graph demonstration of the high correlation between human and mouse microarray expression. The duplicate arrays were scored as present (1), marginal (0.5) or absent (0) and summed. Excellent agreement is observed for genes with two present calls in mouse and human with over 70% of all detected probes correlating expression in human and mouse. Furthermore, the majority of probes with absent calls also agree in human and mouse. (B) A scatter plot distribution of Jaccard scores for 5 human tissues against 55 mouse tissues is represented. Data were obtained from the GEO repository and J-scores were pair wise calculated. In each case, the corresponding mouse and human tissues always showed the highest correlation (solid red circle) as compared with the other 54 tissues (open circles).

