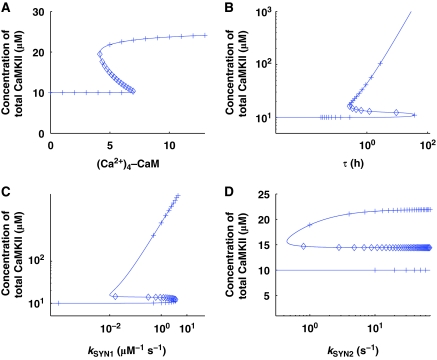
Figure 5.
Numerical and analytical bifurcation diagrams represent the steady-state solutions of this dynamic system with respect to model parameters. Numerically (solid lines), these steady-state solutions are tracked with a nonlinear global continuation-based solver. The analytical bifurcation diagrams (cross and diamond signs, where cross represents the stable analytical branches (‘up' and ‘down' states) and diamond sign represents the unstable analytical branch) are generated using an analytical expression, which is obtained by analytically solving all the equations and converting them into a single nonlinear expression. Both numerical and analytical bifurcation diagrams completely match each other. Four key parameters are selected for generating bifurcation diagrams. (A) The intensity of the [(Ca2+)4–CaM] signal, (B) turnover rate (τ), (C) protein synthesis rate (kSYN1), (D) protein synthesis rate (kSYN2).

