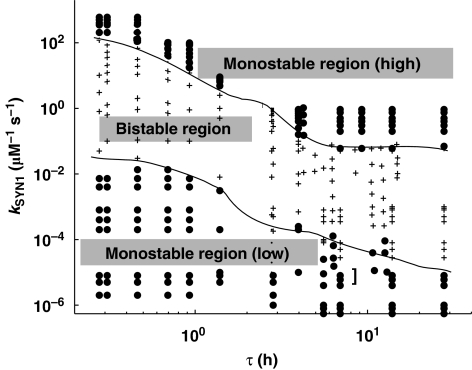
Figure 6.
Phase diagram of the αCaMKII–CPEB1 loop. Two key parameters are selected for phase envelope: (i) the αCaMKII turnover rate, τ and (ii) the new protein synthesis rate, kSYN1. This phase diagram is characterized by three regions: a low monostable region with only one downregulated steady state; a high monostable region with only an upregulated steady state; and a bistable region that has both up- and downregulated steady states.

