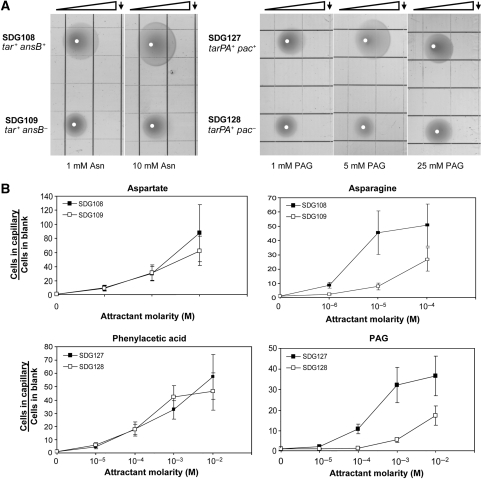
Figure 2.
Assays for chemotaxis. (A) Panels show images of bacteria 19 h (for SDG108 and SDG109) or 24–27 h (for SDG127 and SDG128) after inoculation on soft-agar plates containing a gradient formed by spotting attractant onto the line indicated by the arrow. Images shown are representative of experiments that were carried out at least three times. White dots indicate the points where culture was applied to the plates. Grid squares are 13 mm × 13 mm. (B) Capillary assays of the designed strain SDG108 and the control strain SDG109 with a range of aspartate and asparagine concentrations, and of designed strain SDG127 and the control strain SDG128 with a range of PAA and PAG concentrations. For each strain and attractant concentration, the number of cells that accumulated in the capillary was normalized by dividing by the number of cells of the same strain that accumulated in a blank—that is, a capillary containing buffer but no attractant. Results are the averages of experiments on at least three capillaries. Error bars indicate standard errors.

