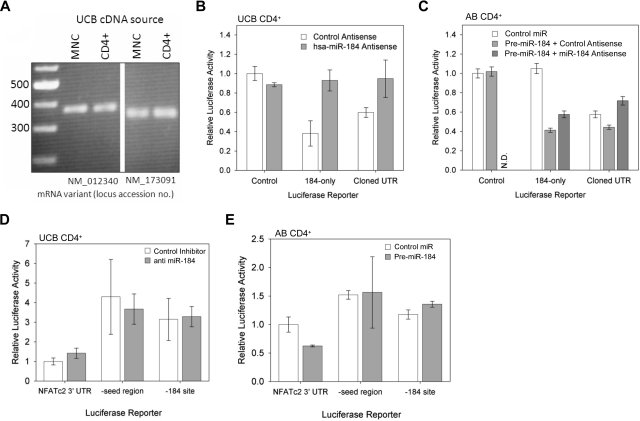
Figure 4.
Interaction between the NFATc2 3′ UTR and miR-184. (A) PCR amplification of the predicted target region from UCB MNC and CD4+ cDNA. Sequences of primers are specified in the Methods section. (B) Expression of luciferase in transfected UCB CD4+ cells under the influence of minimal 3′ UTR (left column), the predicted miR-184 binding site from NFATc2 (middle column), or the cloned 3′ UTR from NFATc2 (right column) with antisense sequence to miR-184 or irrelevant control DNA sequence (representative of 3 independent experiments). (C) Expression of luciferase in transfected AB CD4+ cells under the influence of the aforementioned 3′ UTRs, exogenous pre-miR-184, and antisense to miR-184 (representative of 3 independent experiments). N.D. indicates data not determined. (D) Expression of luciferase in transfected UCB CD4+ cells under the influence of the cloned NFATc2 3′ UTR (left column), the same UTR with the predicted miR-184 seed region (4 nucleotides [nt]) removed (middle column), and the same UTR with the entire predicted miR-184 binding site removed (right column) with and without antisense to miR-184 (representative of 2 independent experiments). (E) Expression of luciferase in transfected AB CD4+ cells under the influence of the aforementioned 3′ UTRs, with and without precursor to miR-184 (representative of 2 independent experiments).

