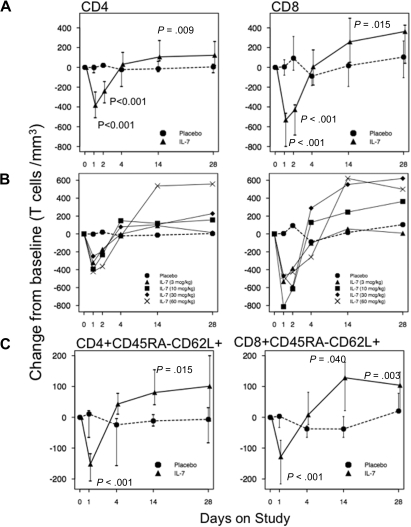
Figure 2.
Changes in T-cell counts after rhIL-7 administration. (A) CD4+ and CD8+ T-cell counts decreased significantly on days 1 and 2 and increased significantly on day 14 after the rhIL-7 dose. ● represents placebo participants ( ) and ▲ represents rhIL-7 participants (
 ). (B) CD4+ and CD8+ T-cell changes from baseline according to rhIL-7 dose group. ● represents placebo participants (
 ) and rhIL-7 participants are represented by ▲ (3 μg/kg), ■ (10 μg/kg), ♦ (30 μg/kg), and X (60 μg/kg). (C) Central memory CD4+ and CD8+ T cells decreased significantly on day 1 and increased significantly on day 14 and day 28 (CD8+ T cells) after a single rhIL-7 administration. ● represents placebo participants (
 ) and ▲ represents rhIL-7 participants (
 ).
).

