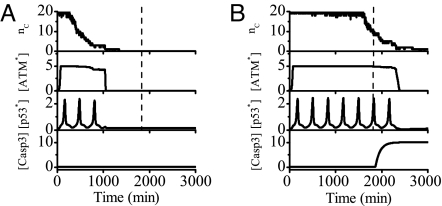
Fig. 4.
Overview of signal transduction in the p53 network. Shown are time courses of the output of each module at the IR dose of 3 Gy (A) or 5 Gy (B). Upon IR, a number of DSBCs, nC, are produced and then ATM is activated, initiating the p53 oscillations. When DNA damage is effectively repaired, the ATM switch is turned off and the concentration of p53* returns to a low level. At low IR doses, few p53 pulses cannot activate Casp3 and the cell recovers to normal growth. At high doses, sustained p53 pulses lead to activation of Casp3 and apoptosis ensues. The dashed lines denote a threshold time for cell fate decision.

