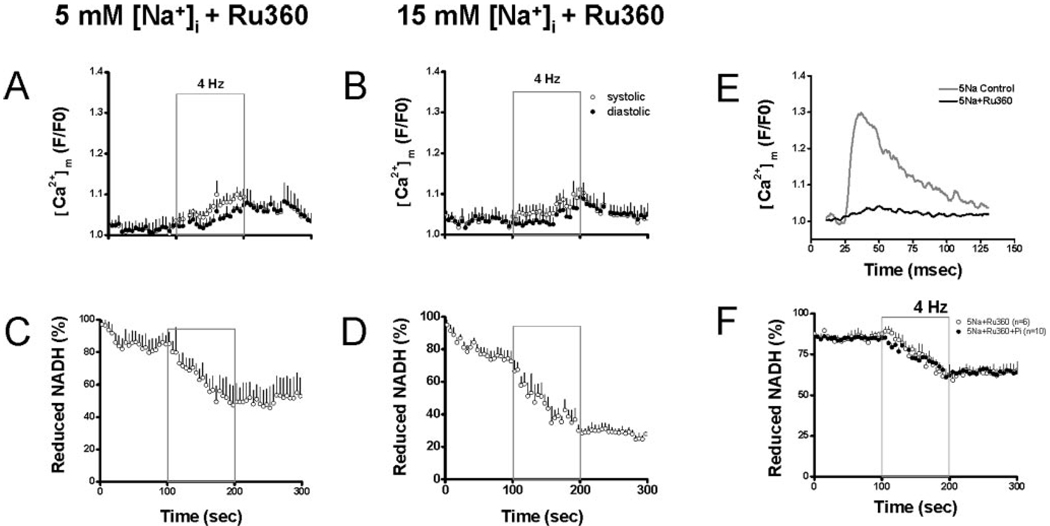
Figure 3.
Effects of Ru360. A–D, In the presence of Ru360, rhod-2 fluorescence (A–B) and NADH fluorescence (C–D) were recorded in cells with 5 or 15 Na+. E, Representative tracing of [Ca2+]m transient with or without Ru360 in cells with 5 mmol/L Na+. F, Recording of NADH fluorescence in the presence of Ru360 alone or Ru360 plus Pi in cell with 5 mmol/L Na+

