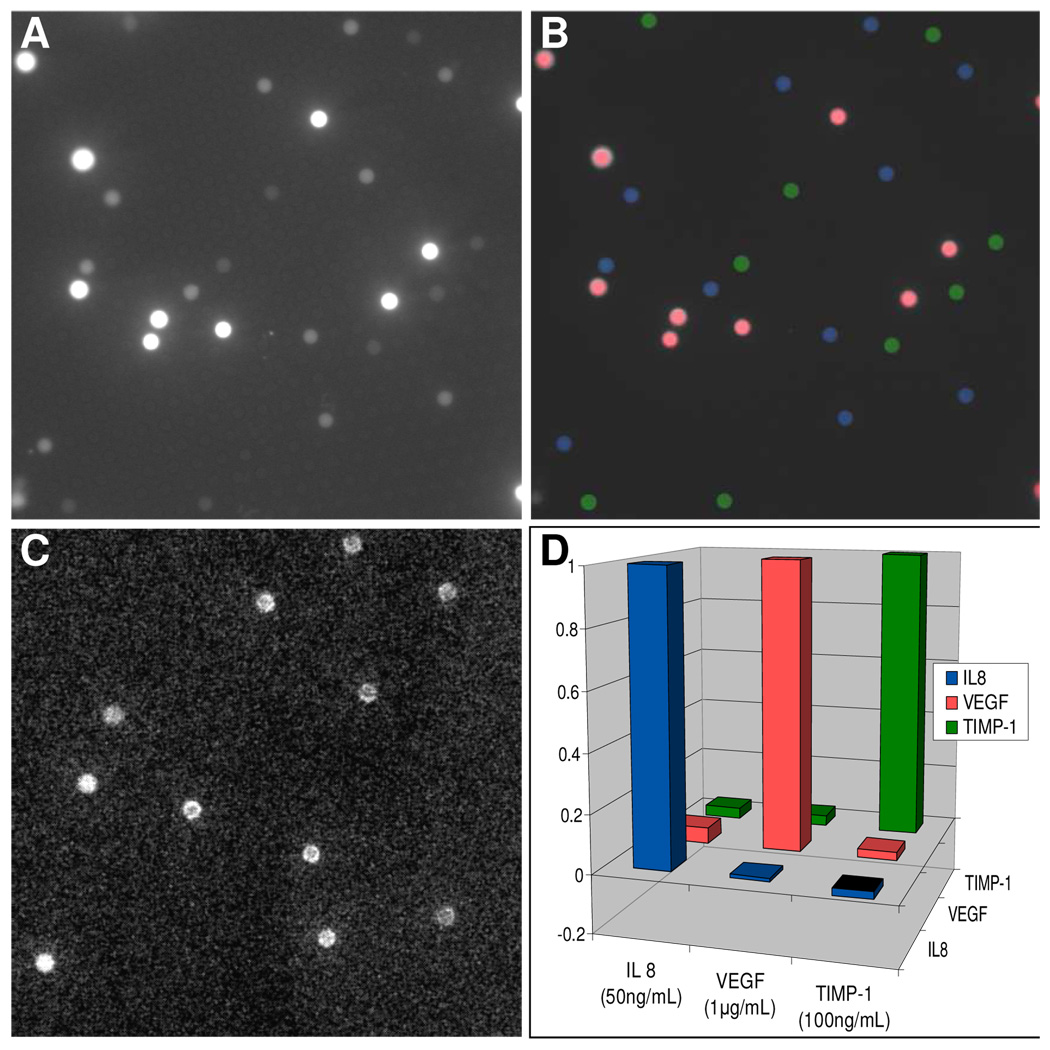
Figure 2.
(A) Fluorescence image showing the presence of anti-VEGF, IL-8, and TIMP-1 modified 3.1 µm beads, which are internally encoded with high, intermediate, and low amounts of Eu3+ dye, respectively. (B) False-color overlay of the region of interest (ROI) defined in (A) identifying anti-IL-8 (blue), VEGF (red), and TIMP-1 (green) beads. (C) ECL image of the same ROI following exposure to 50 ng/mL of IL-8. Note that only the blue beads give an ECL signal. (D) Normalized cross-reactivity plot for three experiments where a single antigen was presented to an array containing all three bead types. ECL images were acquired over a 12 s exposure time while the potential was scanned from 0.8 V to 1.4 V vs. Ag/AgCl/KCl in a 100 mM TPrA solution.

