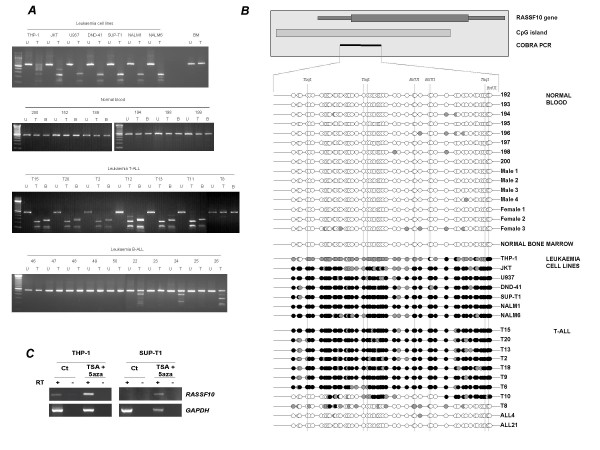
Figure 3.
RASSF10 is hypermethylated in childhood leukaemias. A, COBRA analysis showing methylation status of RASSF10 in leukaemia cell lines and normal bone marrow, normal blood, primary T-ALL and primary B-ALL. No methylation was observed in normal blood or bone marrow (BM). U = undigested PCR product; T = TaqI digested PCR product. B = BstUI digested PCR product. B, Direct bisulphite sequencing of normal blood, normal bone marrow, leukaemia cell lines and primary T-ALL leukaemias. Top shows a schematic of the region amplified by COBRA PCR (black bar) relative to the RASSF10 gene and CpG island region (hatched bar). Each horizontal line represents the total DNA amplified from the sample whilst the circles represent single CpG dinucleotides. Filled black circle represents a completely methylated CpG dinucleotide, open circle represents a completely unmethylated CpG dinucleotide and filled gray circle represents a partially methylated CpG dinucleotide. The dashed vertical line indicates the CpG dinucleotides within TaqI (TCGA) and BstUI (CGCG) restriction sites used to assay for methylation. C, Methylation of the RASSF10 CpG island correlates with loss or downregulation of RASSF10 expression. The partially methylated cell line THP-1 and the completely methylated cell line SUP-T1 were cultured in the presence or absence of 5azaDC and TSA. RT-PCR analysis showed loss or downregulation of RASSF10 expression correlates with the methylation status of the RASSF10 CpG island (A and B). RASSF10 expression is restored following 5azaDC and TSA treatment. GAPDH was used as a control for RNA integrity and equal loading. Ct = control mock treated; RT = reverse transcriptase.

