
Figure 2.
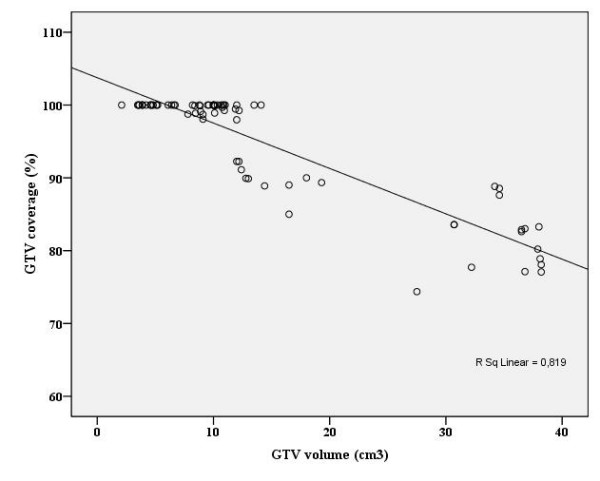
Scatter-plot for gross tumor volume (GTV) vs. percentage of coverage of these volumes by the 7 Gy isodose.
Official websites use .gov
A
.gov website belongs to an official
government organization in the United States.
Secure .gov websites use HTTPS
A lock (
) or https:// means you've safely
connected to the .gov website. Share sensitive
information only on official, secure websites.
Scatter-plot for gross tumor volume (GTV) vs. percentage of coverage of these volumes by the 7 Gy isodose.