
Fig. 1.
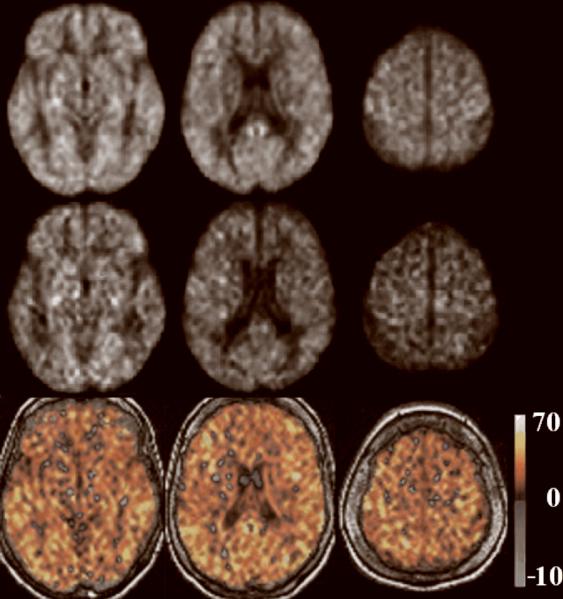
Group average CASL CBF images for HC and AD are shown in the 1st and 2nd row, respectively, at three axial locations from lower, middle, and upper brain. Corresponding difference images (HC-AD) are shown in the 3rd row. Units in the color bar are in [mL/100g•min].