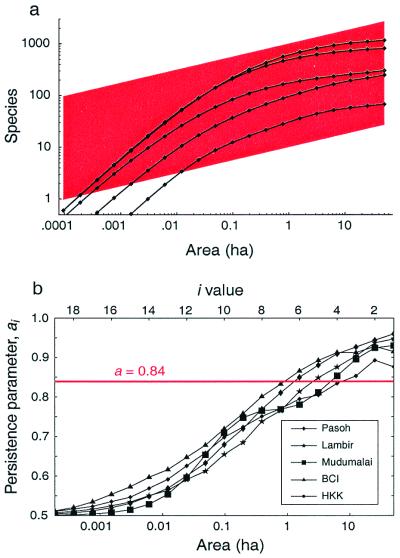
Figure 2.
Graphs of the SAR and the spatial persistence parameter for each of five tropical forests. (a) Log-log graph of the observed species-area data. Each plot encompasses a total area A0 = 50 ha. We measure the mean species diversity, Si, found in disjoint patches obtained by repeated bisections of A0. The log-log species-area data are concave down for all five plots. The SAR is approximated loosely by the power law, z = 0.25, whose slope is indicated by the trapezoid (red). (b) The persistence parameter, ai = Si/Si−1, provides a sensitive tool for analyzing SARs and testing self-similarity. Self-similarity would predict constant a ≃ 2−0.25 ≃ 0.84, shown in red. All five persistence curves are seen to depart from the power-law model over the entire range of areas.

