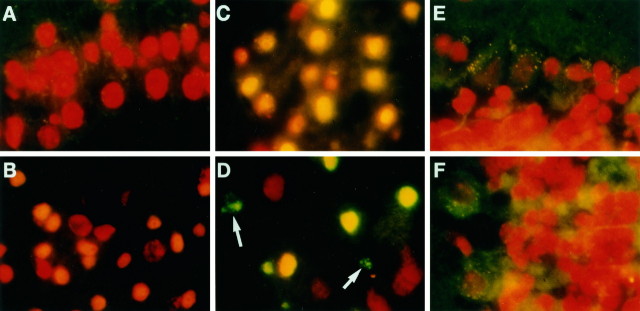
Fig. 10.
DNA fragmentation after forebrain ischemia (30 min). Photographs were taken using a mercury light source with filters [dual exposures: a first exposure with Leica (Deerfield, IL) I3 filter (excitation 450–490 nm; barrier at 510 nm) for fluorescein and a second with N2.1 filter (excitation 515–560 nm; barrier at 580 nm) for PI], and with 1000× magnification in one representative animal of selected time point. A, Layer II nuclei of normal cortex from animal without ischemia. B, C, Layer II nuclei of the cortex and CA 3 nuclei of the hippocampus with 1 d of reperfusion, respectively. D, Caudate putamen nuclei with 3 d of reperfusion. E, F, Nuclei from the cerebellum of normal brain and of brain with ischemia and 3 d of reperfusion, respectively. Nuclei with PI stain appeared red, whereas nuclei with anti-dig-fluorescein conjugates and incorporated dig-dUMP on the DNA fragment appearedbright green (D, TUNEL-positive nuclei). Nuclei with the appearance of orange oryellow fluorescence in B, C, andD suggest a blend of red (PI stain) withslight green (conjugates of anti-dig-fluorescein and dig-dUMP).

