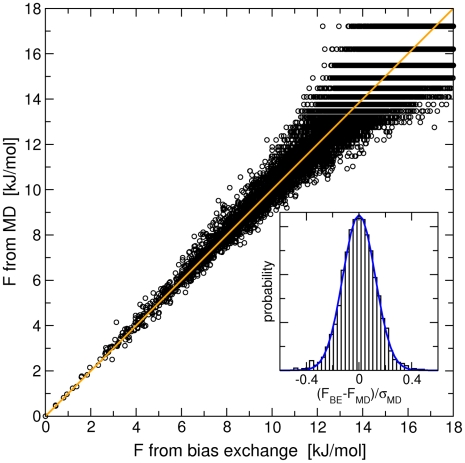
Figure 1. Bins free energies of Ala3 from BE and from MD.
Correlation between the bins free energies calculated using Eq. 6 applied on BE simulations data and using the standard thermodynamics relation  on MD results. A bin size of 30° has been used. In the inset it is shown the distribution of the deviations between the bins free energies calculated from BE and from MD, divided by the estimated error on the MD free energy. A Gaussian fit of the distribution is also shown.

