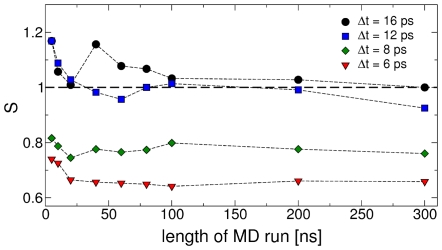
Figure 3. Dependence of the diffusion coefficient of Ala3 on the time lag and the trajectory length.
Dependence of the slope  of the line fitting the pairs of mean first passage times
  (see text and Fig. 2A) from the parameters used in the fit of the diffusion matrix
  : the length of the MD run and the time lag
  . For
. For  converges to the optimal value 1 (dashed line). A cubic side of 30° was used.

