
Figure 4.
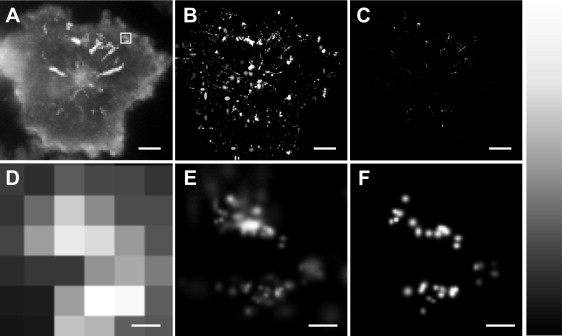
TIRF images of a live T cell in which the protein LAT has been labeled with enhanced YFP. The image was recorded with an exposure time of 0.1 s and is shown in the raw diffraction limited format (A and D, plotted as the maximum pixel intensity for 3000 frames), after Gaussian fitting (B and E, the sum of 3000 frames), and with a Lucky threshold of 15.6 nm applied (C and F, the sum of 3000 frames). The scale bars in the upper panels are 2 μm. The lower panels show the section of the image that is highlighted by the white box in A and the scale bars are 150 nm. The panel to the far right shows the look-up table for the images, ranging from black at low intensity to white at high intensity.