
Figure 5.
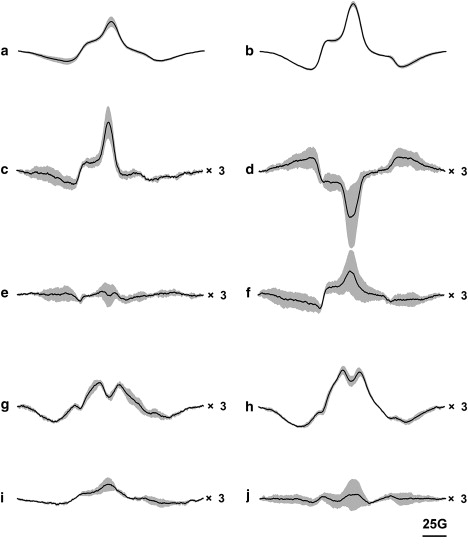
EPR difference spectra at 120 K, calculated by subtracting the nonilluminated EPR spectra from the illuminated spectra in Fig. 3. Panels a and b are A103R1/M163R1 at pH 6 and pH 9; c and d are V101R1/A168R1 at pH 6 and pH 9; e and f are L100R1/T170R1 at pH 6 and pH 9; g and h are S169R1/S226R1 at pH 6 and pH 9; and i and j are G106R1/G155R1 at pH 6 and pH 9, respectively. Black lines are the difference spectra, and gray shadows are the standard errors. Statistics were calculated from three sets of individual experiments for each nonilluminated and illuminated state. Spectra c–j were scaled up to a and b by multiplying by 3. The vertical axes are arbitrary.