
Figure 2.
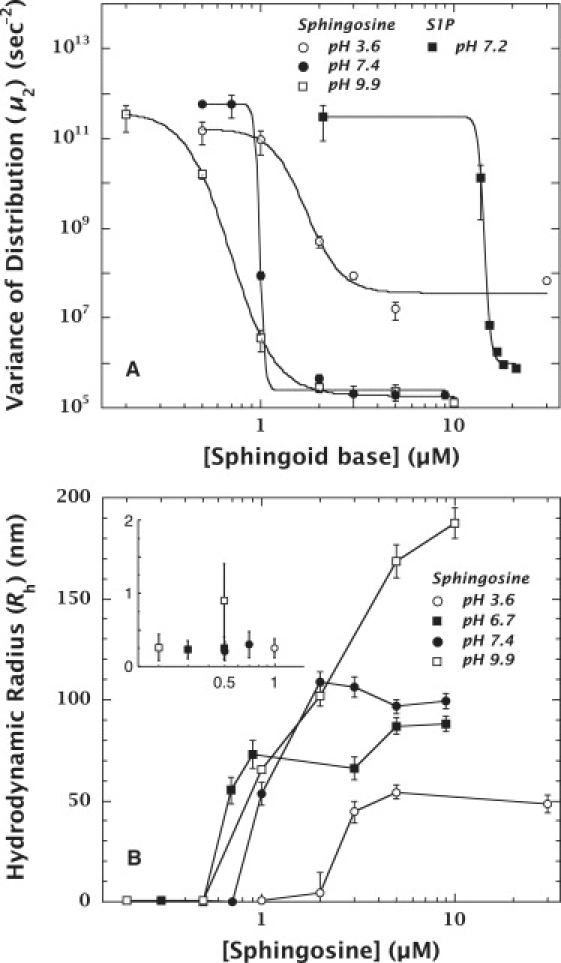
Aggregation behaviors of sphingosine and S1P at various pH values. (A) Change in μ2 values at 25°C of sphingosine and S1P. The data for sphingosine at pH 3.6, 7.4, and 9.9 are depicted by open circles, solid circles, and open squares, respectively. The data for S1P at pH 7.2 are represented by solid squares. Aggregation is indicated by the decrease in the polydispersity parameter (μ2) (34,39). These data suggest that pH has a strong effect on the aggregation behavior of sphingosine, and that the concentrations at which half-aggregations occur (C50) are 1.71 ± 0.24 μM (pH 3.6), 0.99 ± 0.12 μM (pH 7.4), and 0.70 ± 0.02 μM (pH 9.9). These data also demonstrate that the attachment of a phosphate group to sphingosine increases the solubility of S1P. The C50 at physiological pH (7.2) of S1P (14.35 ± 0.08 μM) was 14-fold higher than that of sphingosine. (B) Rh of sphingosine in buffers (pH 3.6, 7.4, and 9.9) at different concentrations at 25°C. The data for pH 3.6, 7.4 and 9.9 are depicted by open circles, solid circles, and open squares, respectively. The inset shows the small, but nonzero, values of Rh at concentrations below the CMC. These data show that the sphingosine aggregates formed at pH 9.9 are larger than those formed at pH 3.6 or 7.4, and continued to increase in size depending on the concentration between 0.5 μM and 10 μM. Compared with panel A, the aggregation ranges at both pH values revealed by the changes in Rh were consistent with those shown by μ2.