
Figure 3.
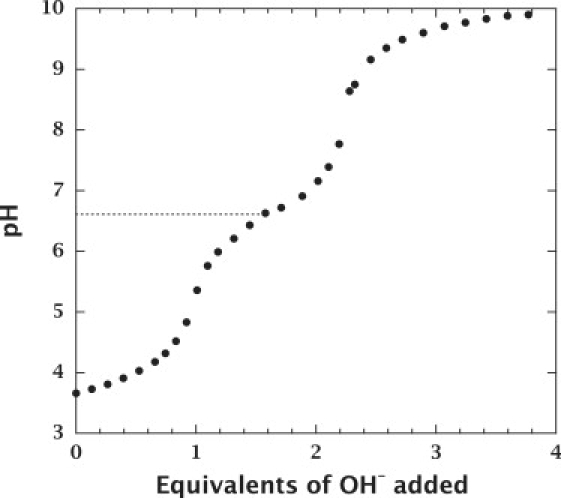
The pH titration curve of sphingosine. The initial concentration of sphingosine was 200 μM. The concentration of sphingosine decreased along with the increase in volume (up to 1.7-fold) during titration, but sphingosine exists as aggregates over the entire pH range (see Fig. 2A). The NaCl concentration was constant at 140 mM during titration. The pKa of aggregated sphingosine was determined to be 6.61 ± 0.03.