
Figure 7.
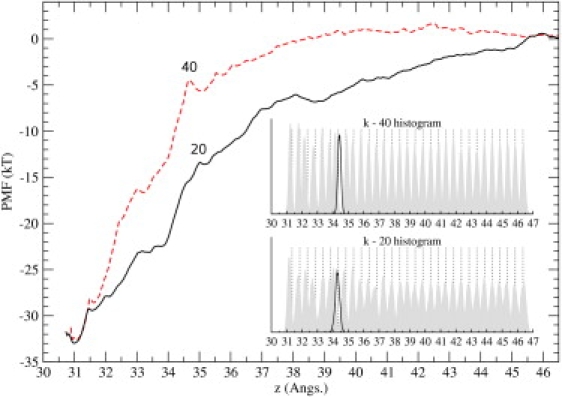
Comparison of the PMFs obtained from the umbrella sampling simulations using the force constants of 20 kcal/mol/Å2 (solid line) and 40 kcal/mol/Å2 (dashed line). The same routine employed in the construction of the k-20 PMF has been used for the k-40 PMF. (Inset) Distribution of the ChTX-COM as overlapping histograms along the reaction coordinate. For each window, we display the actual distribution of the ChTX-COM (shaded histogram) and its constraint coordinate (dotted line, usually to the right). (Solid curve) Distribution for the extra window (to cover the poorly sampled region, see Methods).