
Figure 5.
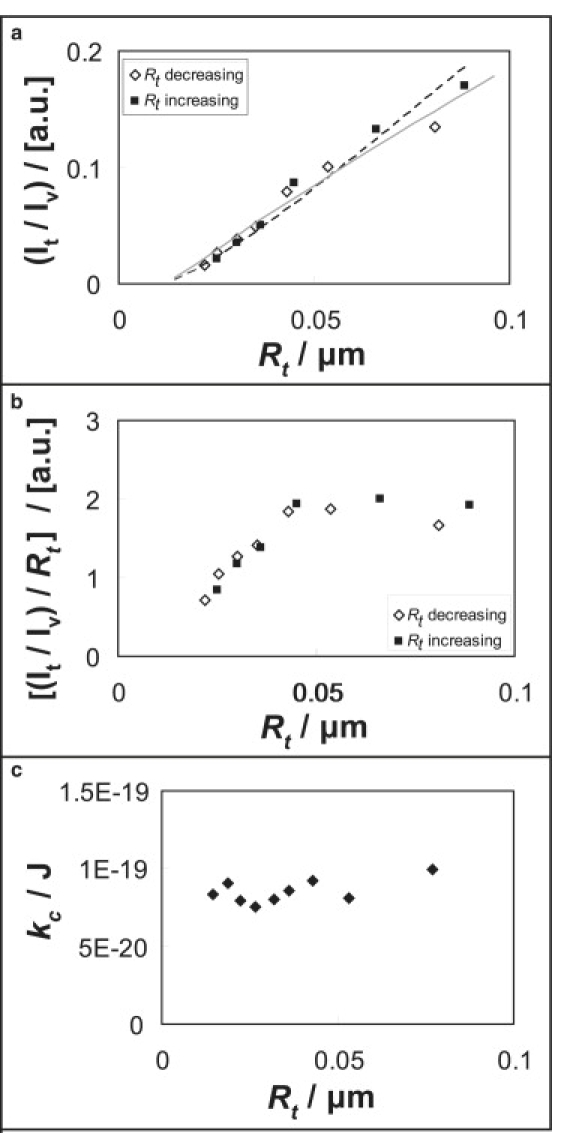
(a and b) Reversibility test of tether intensity at varying tether radius of POPC (2% GM1) membrane labeled only with CTB-A488. Tether intensity is normalized with respect to vesicle intensity. The dashed line refers to the fitting of data points using the spontaneous curvature sorting model, and the gray solid line to fitting with the bending stiffness sorting model. (b) Same data as in panel a additionally scaled with membrane curvature. (c) Bending stiffness versus tether radius of POPC (1% GM1) membrane labeled with both CTB-A488 and TR-DHPE. Note that these bending stiffness values refer to the data set of the first column in Fig. 4.