
Figure 3.
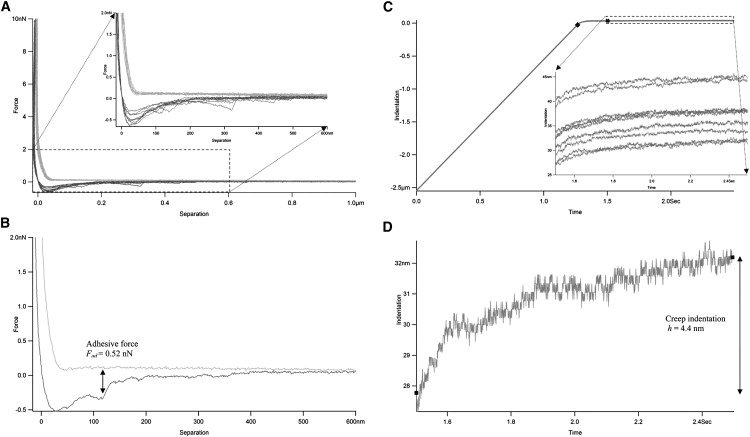
Determination of biofilm adhesion and creep indentation by microbead force spectroscopy. (A) Representative force-separation plots (force plots) during approaches (light lines) and retractions (dark lines) in MBFS experiments. Inset shows more details of the expanded interaction region. Negative separation resulted from sample indentation. (B) Measurement of adhesive force from a sample force plot. (C) Representative indentation-time curves (creep curves) during dwell in MBFS experiments. Inset shows more details of the expanded creep region. Negative indentation indicated the ramp region before sample contact. (♦) Beginning of contact and instantaneous indentation; (#) End of instantaneous indentation and beginning of delayed or creep indentation. (D) Measurement of creep indentation from a sample creep curve. (■) Start and end of the creep curve.