
Figure 5.
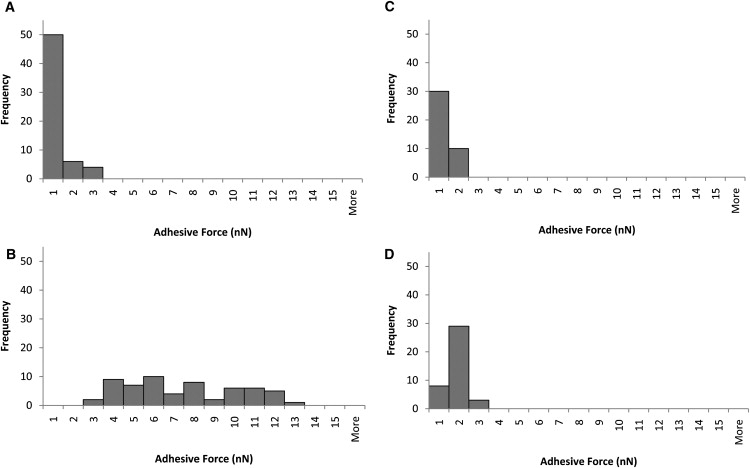
Frequency distributions of Pseudomonas aeruginosa adhesive forces to glass under standard conditions. (A) PAO1 early biofilm. (B) wapR early biofilm. (C) PAO1 mature biofilm. (D) wapR mature biofilm. Histograms show data derived from six independent experiments per early biofilm sample and four independent experiments per mature biofilm sample. Each experiment consists of 10 replicate force plots at standard loading force (10 nN), contact time (1 s), and ramp velocity (2 μm/s) (SFTV).