
Figure 6.
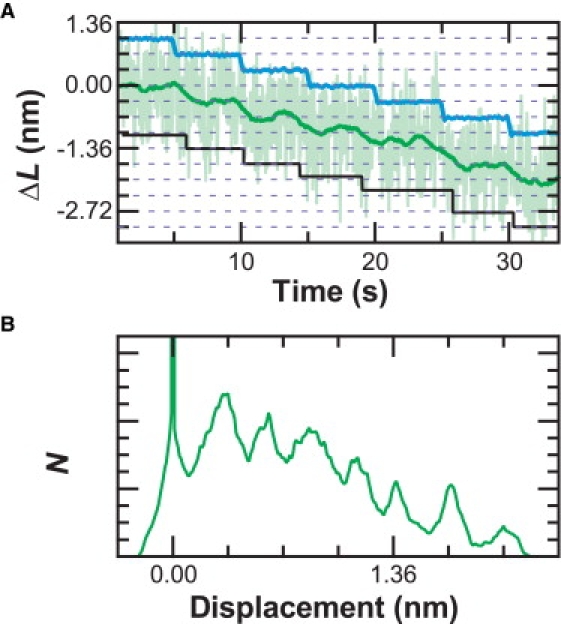
Sensitivity to 1-bp steps. (A) To demonstrate the resolution of the system, the stage was moved in 0.34-nm increments (blue) such that the apparent DNA contour length changes (ΔL). A step-fitting algorithm found steps (black) at 0.33 ± 0.08 nm (mean ± SD, N = 6). Data taken at F = 6 pN and xbd = 70 nm, and then filtered using a Savitzky-Golay window (light green = 5 Hz, dark green = 0.2 Hz). Traces offset for clarity. (B) A pairwise distance distribution of the 0.2-Hz data from A shows a peak at 0.31 ± 0.09 nm (peak ± HWHM).