
Figure 6.
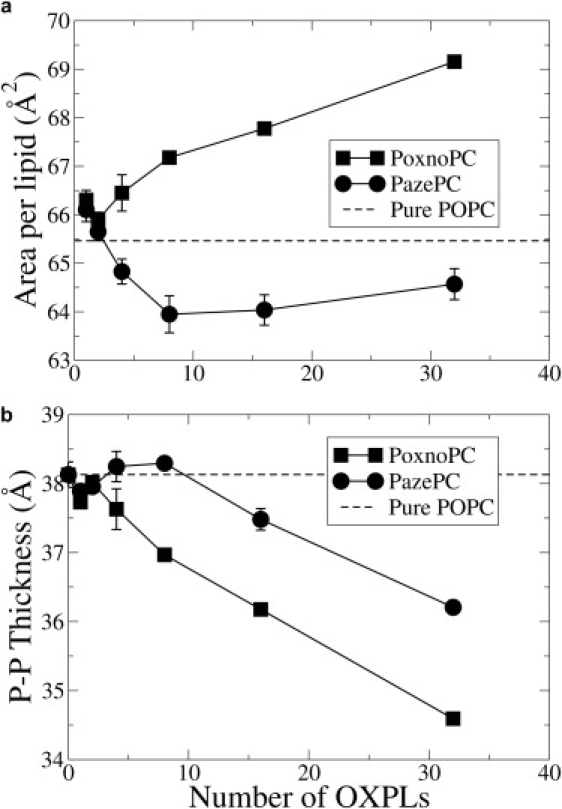
Average area per lipid (a) and thickness (b) of the lipid bilayers at various concentrations of OXPL. The errors were estimated using a block-averaging approach and cannot be seen in some cases because they are smaller than the size of the symbols. The highest block size was 14 ns. The thickness was calculated as the distance between the average positions of the phosphate groups in the two leaflets.