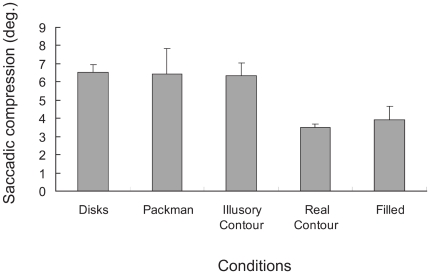
Figure 1. Averaged magnitude of horizontal saccadic compression for participants in Sogo and Osaka's Experiment 1.
Bars indicated the averaged magnitude of the saccadic compression for all conditions: Disks, Packman, Illusory contour, Real contour, and Filled figures. Error bars indicated standard deviation of the compression among their three participants. The figure highlights that Sogo and Osaka observed substantial horizontal saccadic compression even for the control figures: the real contour and filled contour conditions.

