
Figure 5.
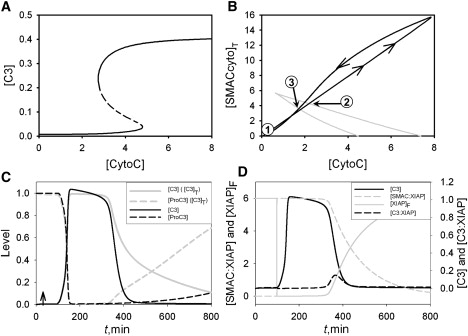
Bifurcation diagrams for the executioner module. (A) One-parameter bifurcation diagram (steady-state C3 activity as a function of CytoC) for [SMACcyto]T = 2. Notations are as in Fig. 4D. (B) Two-parameter bifurcation diagram. Gray lines, loci of saddle-node bifurcations; black line, trajectory of CytoC and [SMACcyto]T in the cytoplasm as apoptosis is executed. See text for more details. (C) Comparison of time courses. Gray lines are computed with constant total caspase 3 and total caspase 9; black lines are computed after incorporating synthesis and degradation of the caspases. See text for more details. (D) Elevated caspase 3 activity is maintained by SMAC-inhibition of XIAP. See text for details. The time-course simulations in B–D are computed with the complete apoptosis model: Stress = 0.1 for t < 30 and 1 for t > 30.