
Figure 9.
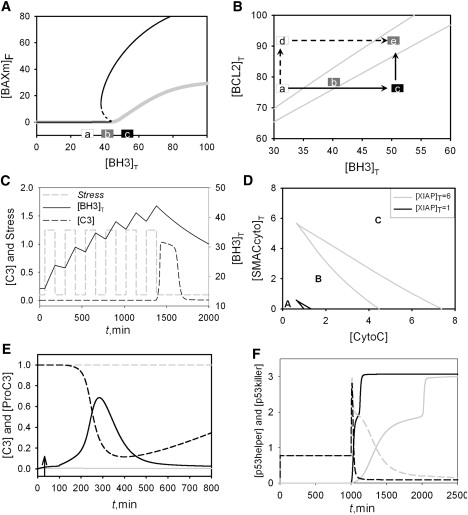
Calculations in support of experimental tests of the model. (A) One-parameter bifurcation diagram for the initiator module, corresponding to wild-type cells (black line) and double-knock-out (bid Δ bim Δ) mutant (gray line, kf2 = 0). Solid and dashed lines correspond to stable and unstable steady states, respectively. Note that bistability is lost in the double-knock-out mutant. Points a–c indicate the values of [BH3]T for the proposed experimental test. Black, white, and gray rectangles indicate active, inactive, and bistable BAXm, respectively. See text for more details. (B) Two-parameter bifurcation diagram. Gray solid lines, saddle-node bifurcation points; black solid and black dashed lines, two proposed ways to elevate protein levels. See text for more details. (C) Simulated time courses of caspase 3 activity (black dashed line) and the level of total BH3 proteins (black solid line). A periodic stress signal (gray dashed line) is begun at t = 60, with Stress = 1.25 for 120 min and Stress = 0.1 for 120 min. The synthesis and degradation rates of BH3 are decreased by 10-fold, ks′BH3 = 0.01, ks″BH3 = 0.06 and kdBH3 = 0.001. (D) Two-parameter bifurcation diagrams of the model corresponding to wild-type cells ([XITP]T = 6, gray) and XIAP deficient cells ([XIAP]T = 1, black). (E) Simulated time courses of caspase 3 (solid lines) and Procaspase 3 (dashed lines) corresponding to wild-type cells ([XITP]T = 6, gray) and XIAP deficient cells ([XIAP]T = 1, black). The initial concentrations of CytoC and SMAC inside the mitochondria are set at 200. Stress = 0.1 for 0 < t < 30 and Stress = 1 for t > 30. (F) Simulated time courses of [p53helper] (dashed lines) and [p53killer] (solid lines) for wild-type cells (gray) and DYRK2 mutant cells (black). The DYRK2 mutant (enhanced nuclear uptake) is mimicked by setting kin at 0.0015. DNA damage = 0 for 0 < t < 1000; DNA damage = 10 for t > 1000.