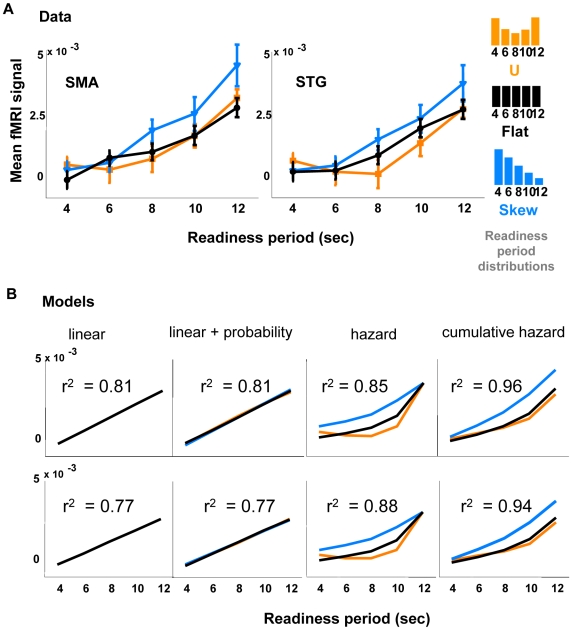
Figure 4. The fMRI signal is modulated by the probability distribution of the timing of go signal.
(A) Inset shows three readiness period probability distributions for the SMA, as presented in different trial blocks. Black, orange, and blue lines represent flat, U-shaped, and skewed distributions of readiness period, respectively. In the flat distribution, the probability of each readiness period is 0.2. For the U-shaped block the probabilities are: 4 s, 0.28; 6 s, 0.16; 8 s, 0.12; 10 s, 0.16; 12 s, 0.28. For the skewed block: 4 s, 0.36; 6 s, 0.28; 8 s, 0.2; 10 s, 0.12; 12 s, 0.04. (B) Best fits for the four models described in the text. The cumulative hazard function provides the most accurate fit of the data. Specifically, by taking the residual differences between data and fit, and calculating a t-test between the cumulative hazard model and each of the others, we found in the SMA that the cumulative hazard fits significantly better than the other three (p<0.01, 0.01, 0.02, respectively). Another method, which directly tests the null hypothesis that the observed r 2 = 0.96 in our sample for the cumulative hazard model is from a population correlation r 2 = 0.85 (see Methods for full details), yields p<0.01, which is comparable to the previous method. In the STG, we find p<0.11 (t-test on residual) and p<0.15 (correlation coefficient distribution) between the cumulative hazard model and hazard model, indicating a trend favoring the cumulative hazard model.

