
Figure 5.
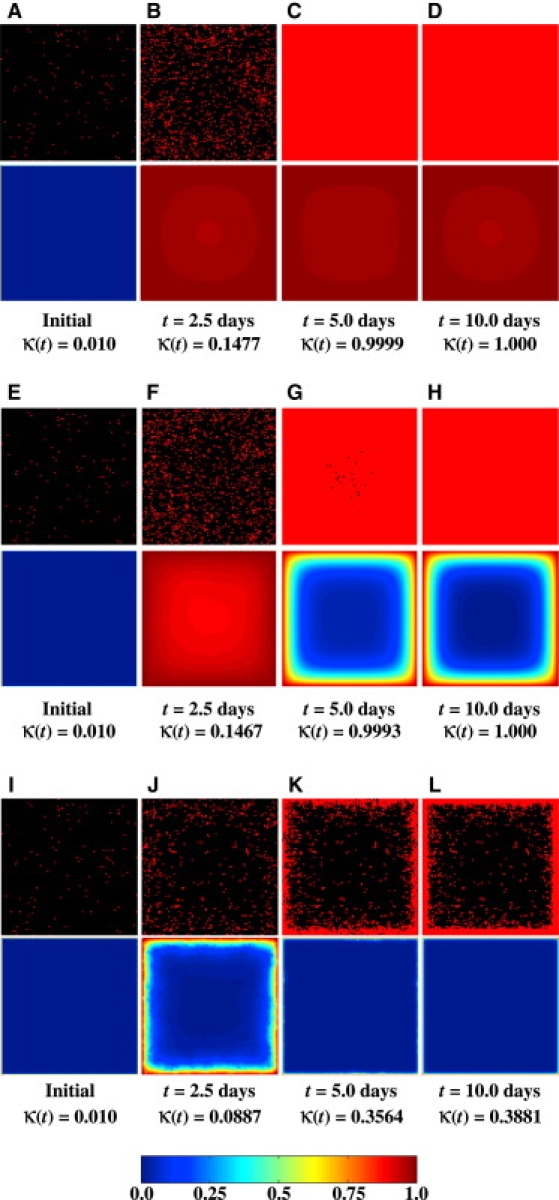
Temporal evolution of spatial cell distributions and nutrient (glucose) concentrations for three runs with the same initial cell configuration but different values of the Thiele modulus. The top half of each image pair shows the cells (gray dots in print or red dots online) located on a horizontal section plane through the center of the cubic scaffold, and the bottom half depicts the dimensionless nutrient concentration, u(ξ,ψ,ζ,τ), according to the scale shown by the color bar located at the bottom of the figure. Note that u varies from 0 to 1 as the nutrient concentration, C(x, y, z, t), varies from 0 to Cb. This applies to all subsequent figures containing similar surface plots of the dimensionless nutrient concentration. (A–D) ϕ = 0.1ϕ∗. (E–H) ϕ = ϕ∗. (I–L) ϕ = 10.0ϕ∗.