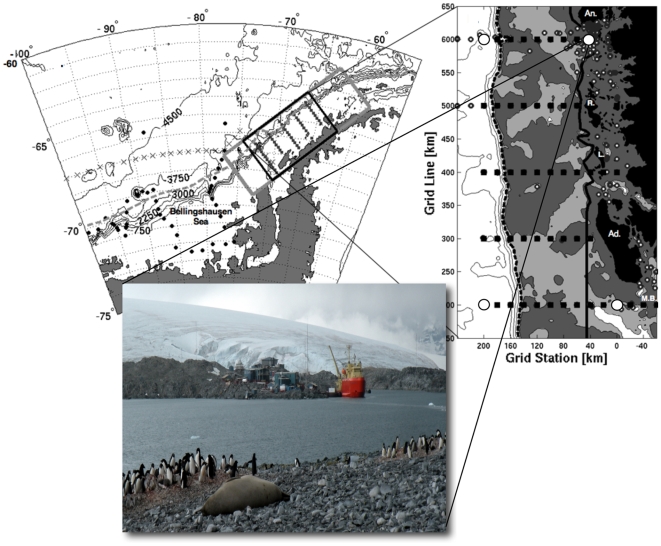
Figure 2. Palmer Station Long Term Ecological Research Site sampling stations included in this study.
The chart on the left depicts the Palmer LTER sampling grid along the west Antarctic Peninsula. The chart on the right is a blow-up of the sampling grid showing the locations of our 4 sampling sites as white circles. Samples were collected at approximately 10 meters and 100 meters depth from the four (north-south, inshore-offshore) corners of the sampling grid. The shading indicates bottom depth. The inset picture shows Palmer Station.

