
Figure 4.
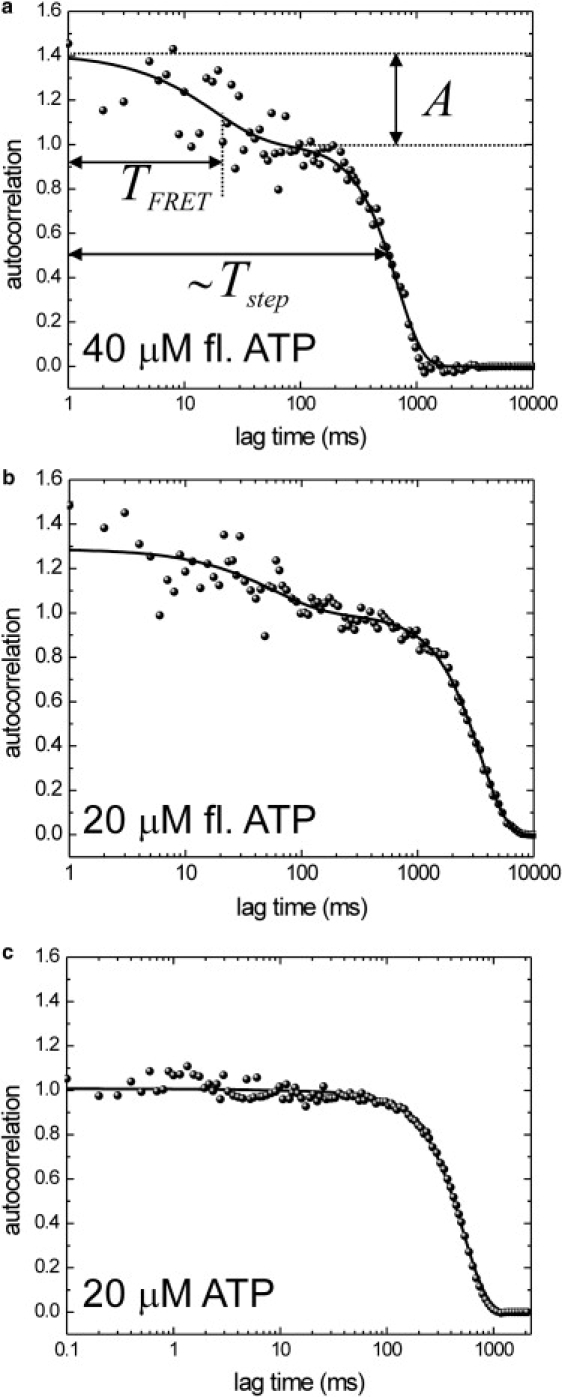
(a) Autocorrelation of the intensity signal represented in Fig. 3 a (40 μM fluorescent ATP). The slower (timescale ∼1 s), Gaussian decay of the autocorrelation reflects the transit time of the kinesin through the confocal spot, and its width is proportional to the velocity and stepping rate. An additional decay of the autocorrelation is observed on a timescale of ∼10 ms. It is due to intensity changes caused by repetitive binding and release of fluorescent ATP. The black curve is a fit of Eq. 2, with A = 0.4 and TFRET = 18 ± 5 ms. (b) Autocorrelation of the fluorescence intensity of a kinesin in the presence of 20 μM fluorescent ATP. The slower rate occurs at a longer timescale, reflecting the lower velocity at this lower fluorescent ATP concentration. In addition, the decay time of the fast FRET component has increased. The solid black curve represents a fit of Eq. 2, with A = 0.29 and TFRET = 57 ms. (c) Intensity autocorrelation of the fluorescence intensity from a single kinesin motor in the presence of regular ATP only. In contrast to a and b, no decay of the autocorrelation can be discerned on a ∼10 ms timescale, and the slower decay is much faster (∼400 ms).