
Figure 5.
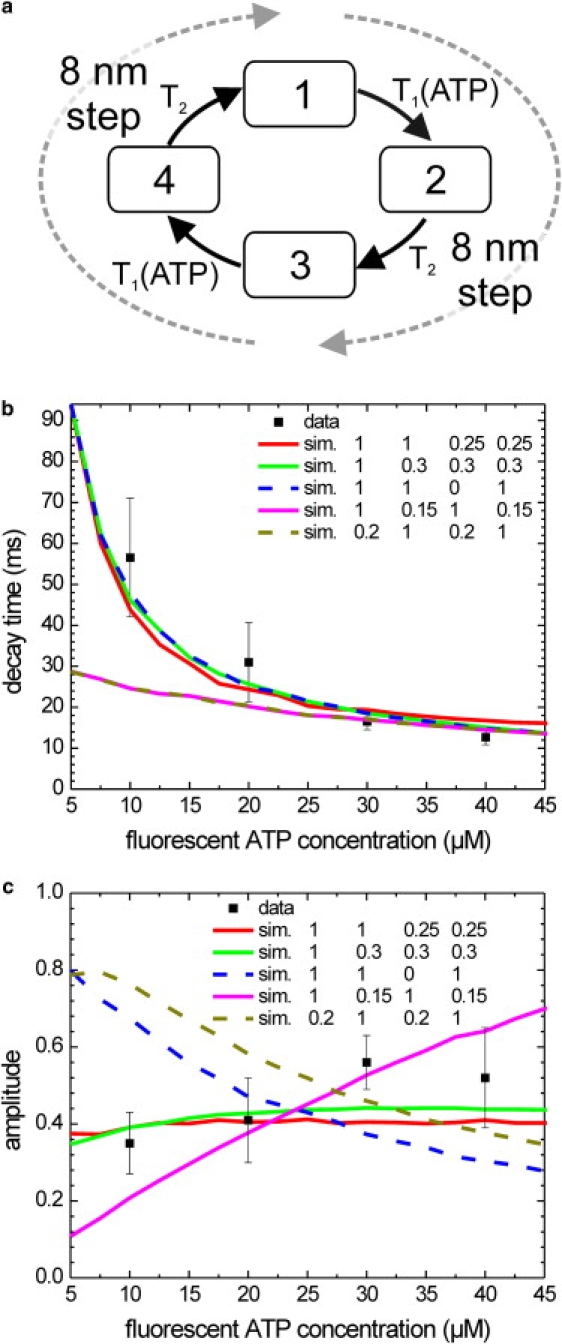
Experimental and simulated decay times and amplitudes of the autocorrelations of donor intensity time traces at different fluorescent ATP concentrations. (a) Schematic representation of the four-state model used for the simulations. Each state has its own intensity, due to differences in FRET efficiency. One full cycle consists of two 8 nm steps and two nucleotide turnovers. Both steps/turnovers are built up of the same transitions, characterized by lifetimes T1 and T2. Only T1 depends on the concentration of fluorescent ATP. (b) Average (mean ± SE) decay times obtained from exponential fits to the experimental (solid squares with error bars) and simulated autocorrelations of the donor fluorescence intensity (colored lines). For all simulations the vmax and Km values obtained from the fit of Fig. 3b were used to determine T1 and T2. Shown are simulations calculated according to the four-state model shown in panel a, with intensities for the respective states as indicated. (c) Average (mean ± SE) amplitude obtained from exponential fits to the experimental (solid squares with error bars) and simulated autocorrelations of the donor fluorescence intensity (colored lines).