
Figure 2.
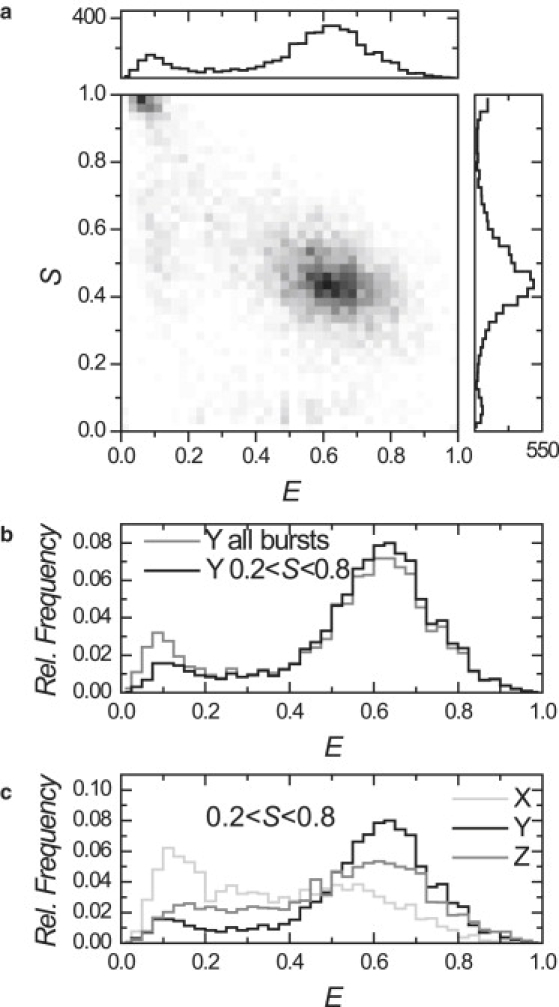
E, S footprint of nucleosomes. (a) Two-dimensional E, S histogram of reconstituted nucleosomes, label position Y. (b) FRET histogram of all bursts (shaded) and of doubly labeled bursts (solid). The low FRET population is reduced considerably by filtering out D-only species. (c) D-only filtered E-histograms for label positions X, Y, and Z in the nucleosome. Note the considerable population at intermediate FRET efficiency.