
Figure 3.
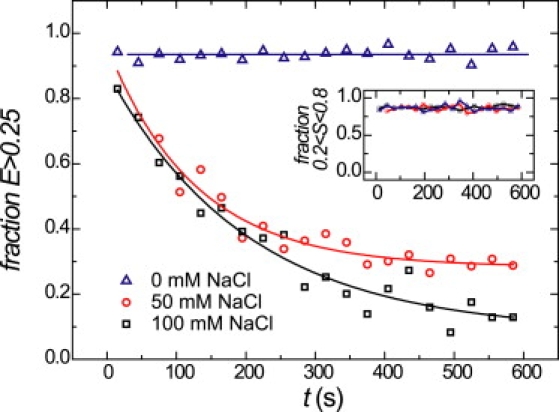
Nucleosome disassembly kinetics for several salt concentrations in time. The fraction of intact nucleosomes (E > 0.25) in time for different monovalent salt concentrations, buffered with 10 mM Tris.HCl (pH 8). The lines are linear (0 mM NaCl) or exponential (50 and 100 mM NaCl) fits to the data. (Inset) The fraction of doubly labeled (0.2 < S < 0.8) molecules in time. For each salt concentration tested, this fraction is constant over time.