
Figure 5.
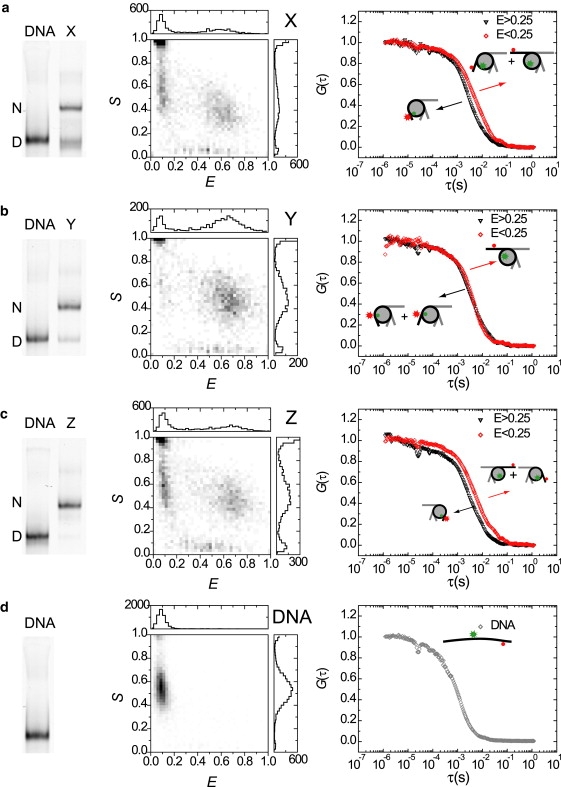
ALEX-spFRET spectroscopy on gel-separated nucleosomes (a) X, (b) Y, (c) Z, and (d) DNA from template Z. (Left panels) Fluorescence image (acceptor excitation) of PAGE analysis of reconstituted nucleosomes and the corresponding DNA templates. N, nucleosome band, D, DNA band. (Middle panels) E, S-histograms of ALEX-spFRET experiments in gel in the nucleosome bands, and DNA band Z depicted. A low FRET peak can be observed in all nucleosome bands, which points at progressive DNA unwrapping from the nucleosome ends. (Right panels) Burstwise FCS analysis on nucleosome populations in gel. For nucleosomes X and Z, a clear difference in correlation time can be seen for different FRET efficiencies, reflecting different conformations. For nucleosome Y, the difference is smaller. All nucleosome populations diffuse significantly slower than the DNA.