
Figure 4.
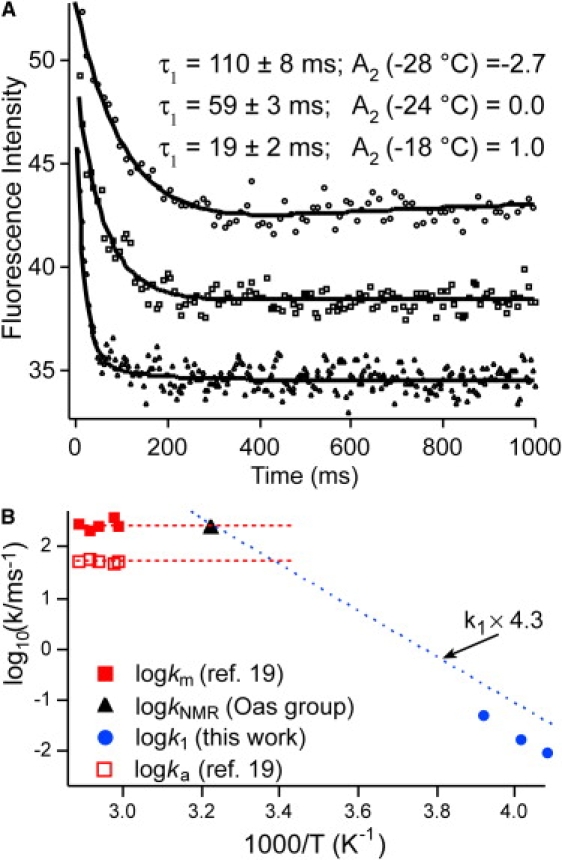
Refolding kinetics observed for by fluorescence. (A) When the temperature is raised, the fast phase speeds up and the slow phase is no longer inverted. (B) Arrhenius plot of the main kinetic phase described in this article (solid circles). A linear free-energy extrapolation, viscosity-corrected from ethylene glycol solvent to water, is shown as a dotted line. Previously measured aqueous T-jump data are shown as squares (solid, molecular-rate coefficient, km; open, activated-rate coefficient, ka, from Yang and Gruebele (23)). The dashed lines indicate the km and ka brackets. The black triangle is the rate coefficient extrapolated from denaturant NMR experiments at 37°C by Myers and Oas ((55) and personal communication (T. Oas, Duke University, 2000)). All three data sets are consistent with a speed limit of ∼(4.5 μs)−1 for at ∼40°C.