
Figure 2.
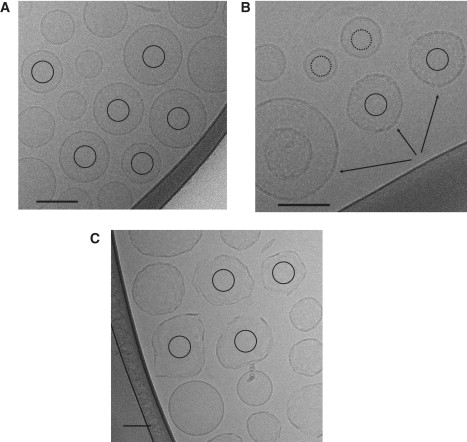
Typical cryo-EM images of (A) DMPC/PG without magainin (control experiment). (B and C) DMPC/PG with magainin. The bottom three vesicles in panel B have arrows showing strongly perturbed vesicles, and the top three are substantially less disturbed. In panel C, both lysed vesicles and minimally perturbed vesicles are observed. Circles inside vesicles indicate the region extracted for computation of power spectra. Scale bar represents 100 nm.