
Figure 3.
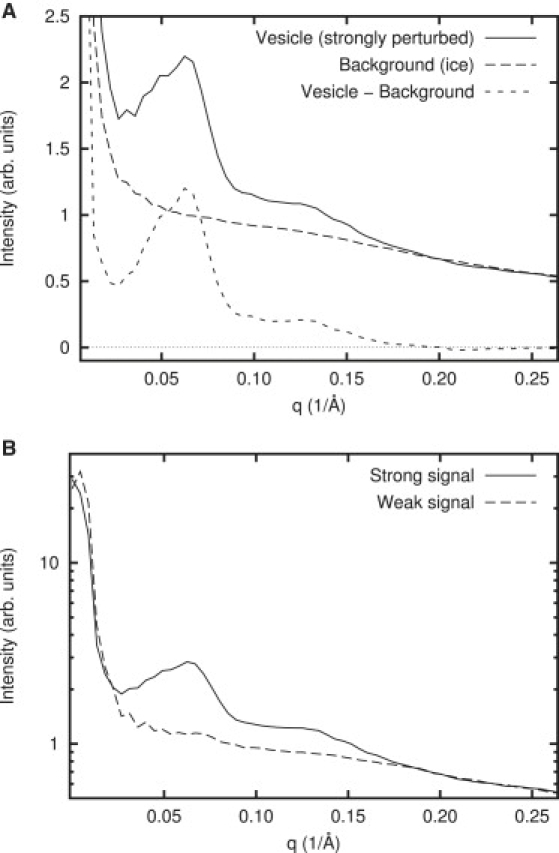
Background subtraction. (A) Example of a raw power spectrum and the background (ice only) subtraction process. The outer region of each vesicle was masked out using a circular mask with a diameter of 66 nm to eliminate the strong signal due to the bilayer edge of each vesicle and to limit the curvature of the vesicle surface. (B) Three-hundred-and-four power spectra from magainin perturbed vesicles including both rough and smooth appearing vesicles were separated into two groups based on peak intensity. The average of 116 strongly peaked power spectra was used as signal, and the average of 188 weakly peaked ones was used as background. The subtraction of the two is the final experimental curve and is used for fitting throughout the data analysis.